
Radon Levels by Minnesota County: All 87 Counties Ranked
Across Minnesota, 36.2 percent of properties tested from 2016 to 2025 had at least one radon result at or above the EPA action level of 4 pCi/L, and 69.0 percent reached 2 pCi/L, in test data the Minnesota Department of Health publishes on its Public Health Data Access portal. That is about 26,137 properties tested every year. The statewide average is 3.8 pCi/L against a U.S. average of 1.3 pCi/L on MDH's own chart (MDH rounds Minnesota to 4 pCi/L and describes it as more than three times the U.S. level), and the median tested home sits at 2.8 pCi/L. This page ranks all 87 counties from the same MDH data, explains what the numbers can and cannot tell you, and gives you the table to reuse.
Which areas of Minnesota have the highest radon levels?
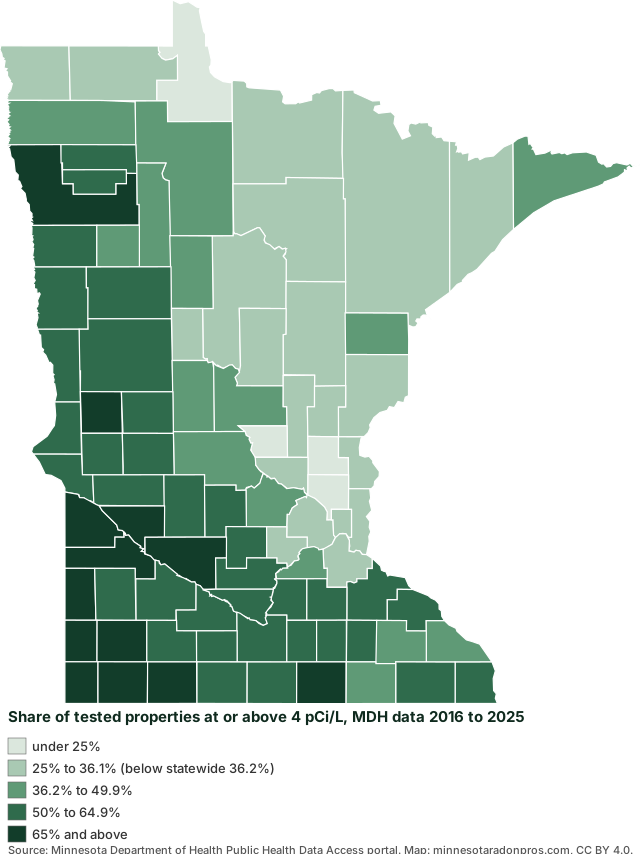
The south and the west, by a wide margin, which is how MDH summarizes its own map. The 10 highest counties are all in southwestern and western Minnesota, with Polk County in the Red River Valley the one northwestern entry. In those 10 counties, more than two of every three tested properties came back at or above 4 pCi/L, and the median home in each is above the action level, meaning more than half of tested homes in those counties would need a mitigation system by EPA guidance. In 48 of Minnesota's 87 counties, half or more of tested properties were at or above 4 pCi/L, and 63 counties run above the statewide share.
| Rank | County | At or above 4 pCi/L | Median | Properties tested per year |
|---|---|---|---|---|
| 1 | Rock | 77.3% | 6.9 pCi/L | 27 |
| 2 | Murray | 73.7% | 6.4 pCi/L | 33 |
| 3 | Lincoln | 73.2% | 5.9 pCi/L | 24 |
| 4 | Nobles | 71.8% | 6.2 pCi/L | 31 |
| 5 | Jackson | 71.7% | 6.1 pCi/L | 30 |
| 6 | Renville | 70.1% | 6.1 pCi/L | 34 |
| 7 | Polk | 69.9% | 6.8 pCi/L | 55 |
| 8 | Pipestone | 68.8% | 5.7 pCi/L | 36 |
| 9 | Chippewa | 68.6% | 5.4 pCi/L | 32 |
| 10 | Lac qui Parle | 67.9% | 5.3 pCi/L | 22 |
Among counties testing at least 30 properties a year, the lowest shares sit in the north metro, central Minnesota and the North Shore: Anoka (15.3%), Isanti (15.7%), Benton (23.1%), Lake (25.6%), St. Louis (26.6%). The Twin Cities counties sit below the statewide share: Hennepin at 34.0 percent (rank 66 of 87), Ramsey at 26.8 percent (rank 81). Olmsted County around Rochester, one of the most-tested counties per household in the state, reads 41.7 percent, Stearns County around St. Cloud 45.3 percent, and St. Louis County around Duluth 26.6 percent.
Every Minnesota county, ranked by MDH radon test results (2016 to 2025)
Sorted by the share of tested properties with at least one result at or above 4 pCi/L. The last column is the same measure from MDH's earlier county map layer (2010 to 2020), so you can see which direction a county moved. An asterisk marks a figure MDH itself flags as unstable because the county had too few tests, in either period.
| # | County | 4 pCi/L or more | 2 pCi/L or more | Average | Median | 95th percentile | Tested per year | 2010 to 2020, 4 or more |
|---|---|---|---|---|---|---|---|---|
| 1 | Rock | 77.3% | 91.1% | 8.1 | 6.9 | 19.7 | 27 | 78.6% |
| 2 | Murray | 73.7% | 89.6% | 8.6 | 6.4 | 24.9 | 33 | 79.7% |
| 3 | Lincoln | 73.2% | 88.3% | 7.9 | 5.9 | 23.7 | 24 | 69.8% |
| 4 | Nobles | 71.8% | 88.8% | 8.3 | 6.2 | 25.8 | 31 | 73.5% |
| 5 | Jackson | 71.7% | 90.2% | 7 | 6.1 | 16.2 | 30 | 73.8% |
| 6 | Renville | 70.1% | 88.7% | 7.3 | 6.1 | 17.2 | 34 | 74.1% |
| 7 | Polk | 69.9% | 86.6% | 9.1 | 6.8 | 21.7 | 55 | 70.0% |
| 8 | Pipestone | 68.8% | 89.3% | 8.6 | 5.7 | 20.9 | 36 | 68.2% |
| 9 | Chippewa | 68.6% | 88.7% | 7 | 5.4 | 18.7 | 32 | 69.9% |
| 10 | Lac qui Parle | 67.9% | 87.9% | 6.5 | 5.3 | 15.3 | 22 | 65.9% |
| 11 | Grant | 66.7% | 89.4% | 6.6 | 5.7 | 15.6 | 12 | 66.4% |
| 12 | Freeborn | 65.8% | 87.8% | 6.6 | 5 | 18.4 | 71 | 68.1% |
| 13 | Yellow Medicine | 65.5% | 87.3% | 6.4 | 5 | 16.8 | 34 | 65.1% |
| 14 | Redwood | 64.7% | 85.6% | 6.2 | 5.1 | 15.3 | 44 | 69.3% |
| 15 | Cottonwood | 64.6% | 82.7% | 6.4 | 4.9 | 16.7 | 36 | 70.8% |
| 16 | Kandiyohi | 63.9% | 85.4% | 6.2 | 4.8 | 15.7 | 123 | 68.8% |
| 17 | Martin | 63.9% | 86.7% | 6.1 | 4.5 | 14.9 | 46 | 64.2% |
| 18 | Lyon | 63.7% | 82.5% | 7 | 5.3 | 19.5 | 116 | 63.8% |
| 19 | Faribault | 63.4% | 86.9% | 6 | 4.7 | 15.8 | 37 | 64.2% |
| 20 | Sibley | 62.8% | 85.1% | 7.4 | 5 | 18 | 52 | 66.9% |
| 21 | Brown | 62.4% | 82.9% | 6.2 | 4.9 | 16.6 | 118 | 71.5% |
| 22 | Dodge | 60.8% | 82.9% | 6.6 | 4.7 | 22.1 | 112 | 64.1% |
| 23 | Stevens | 60.7% | 86.1% | 6.7 | 4.8 | 18.6 | 28 | 60.7% |
| 24 | Waseca | 60.1% | 85.1% | 5.8 | 4.4 | 17.3 | 56 | 61.2% |
| 25 | Otter Tail | 59.9% | 82.3% | 6.1 | 4.5 | 14.7 | 141 | 59.1% |
| 26 | Fillmore | 59.6% | 80.4% | 6.6 | 4.6 | 22.4 | 100 | 62.4% |
| 27 | Traverse | 59.6% | 84.4% | 12.8 | 4.8 | 26.3 | 11 | 62.8% |
| 28 | Big Stone | 59.5% | 80.4% | 6 | 4.2 | 16.8 | 15 | 62.0% |
| 29 | Clay | 59.4% | 80.1% | 6.4 | 4.7 | 17.8 | 209 | 60.2% |
| 30 | Steele | 58.9% | 83.1% | 6.2 | 4.4 | 14.8 | 145 | 61.1% |
| 31 | Watonwan | 58.4% | 81.8% | 5.8 | 4.4 | 14.7 | 21 | 61.1% |
| 32 | McLeod | 58.3% | 82.6% | 5.6 | 4.3 | 14.4 | 154 | 61.9% |
| 33 | Le Sueur | 58.2% | 81.2% | 6 | 4.5 | 15.8 | 123 | 62.3% |
| 34 | Norman | 57.9% | 71.7% | 6 | 4.4 | 16.7 | 15 | 56.6% |
| 35 | Blue Earth | 57.2% | 79.4% | 5.7 | 4.3 | 14.6 | 258 | 59.5% |
| 36 | Red Lake | 56.8% | 86.5% | 5.2 | 4.1 | 12.7 | 4 | 42.0% |
| 37 | Wabasha | 56.8% | 80.2% | 6.2 | 4.4 | 18 | 89 | 64.7% |
| 38 | Pennington | 56.3% | 80.3% | 5.8 | 4.3 | 14.7 | 18 | 58.8% |
| 39 | Douglas | 55.8% | 79.0% | 5.2 | 4.3 | 13.2 | 128 | 61.6% |
| 40 | Nicollet | 55.6% | 81.6% | 5.4 | 4.2 | 14.4 | 173 | 60.0% |
| 41 | Rice | 55.5% | 81.1% | 5.4 | 4 | 13 | 331 | 58.6% |
| 42 | Becker | 54.3% | 81.9% | 5.1 | 4 | 12.7 | 60 | 50.2% |
| 43 | Swift | 52.9% | 79.6% | 4.6 | 3.9 | 11.8 | 19 | 57.1% |
| 44 | Wilkin | 52.8% | 81.9% | 5.3 | 3.9 | 14.4 | 13 | 47.1% |
| 45 | Houston | 52.0% | 79.6% | 4.9 | 3.7 | 13.1 | 74 | 52.5% |
| 46 | Goodhue | 51.5% | 80.0% | 5.5 | 3.8 | 15.8 | 221 | 54.9% |
| 47 | Pope | 51.5% | 78.0% | 4.9 | 3.9 | 13.5 | 47 | 50.5% |
| 48 | Meeker | 51.3% | 80.9% | 4.8 | 3.8 | 12.3 | 60 | 55.4% |
| 49 | Marshall | 46.3% | 76.4% | 5.9 | 3.8 | 21.1 | 12 | 53.3% |
| 50 | Mahnomen | 45.9% | 72.1% | 4.9 | 3.5 | 13.7 | 6 | 57.7% |
| 51 | Stearns | 45.3% | 75.4% | 4.4 | 3.4 | 11.1 | 502 | 49.4% |
| 52 | Clearwater | 43.9% | 75.9% | 4.3 | 3.1 | 11.4 | 19 | 47.2% |
| 53 | Todd | 43.3% | 74.6% | 7.3 | 3.4 | 11.7 | 34 | 43.3% |
| 54 | Mower | 42.8% | 73.9% | 4.9 | 3.3 | 16.2 | 113 | 47.9% |
| 55 | Wright | 42.3% | 73.4% | 4.1 | 3.2 | 11 | 659 | 47.3% |
| 56 | Olmsted | 41.7% | 69.9% | 4.4 | 3.2 | 12.8 | 1,153 | 48.6% |
| 57 | Carlton | 41.5% | 72.7% | 4.8 | 3 | 13.2 | 108 | 41.7% |
| 58 | Winona | 41.3% | 71.7% | 4.3 | 3.1 | 12.8 | 195 | 46.5% |
| 59 | Scott | 40.8% | 70.9% | 4.1 | 3.1 | 11.3 | 829 | 43.6% |
| 60 | Cook | 40.6% | 66.4% | 4.8 | 2.9 | 13.1 | 38 | 40.6% |
| 61 | Hubbard | 39.2% | 73.1% | 3.8 | 3.1 | 9.3 | 69 | 39.3% |
| 62 | Beltrami | 39.0% | 74.0% | 3.7 | 3 | 8.7 | 146 | 40.8% |
| 63 | Morrison | 36.7% | 71.6% | 4.8 | 3 | 9.5 | 64 | 37.5% |
| 64 | Carver | 34.9% | 67.1% | 3.6 | 2.7 | 10.3 | 705 | 39.1% |
| 65 | Kanabec | 34.9% | 69.0% | 3.8 | 2.9 | 12.1 | 28 | 44.5% |
| 66 | Hennepin | 34.0% | 71.2% | 3.4 | 2.8 | 8.1 | 7,894 | 38.0% |
| 67 | Dakota | 33.9% | 67.6% | 3.5 | 2.7 | 8.9 | 2,532 | 37.3% |
| 68 | Pine | 32.9% | 62.2% | 3.3 | 2.6 | 8.5 | 50 | 29.3% |
| 69 | Aitkin | 32.8% | 61.0% | 3.4 | 2.5 | 9.5 | 33 | 32.5% |
| 70 | Sherburne | 31.9% | 64.7% | 3.3 | 2.6 | 8.4 | 369 | 35.8% |
| 71 | Cass | 31.6% | 68.3% | 3.2 | 2.7 | 8 | 75 | 34.4% |
| 72 | Crow Wing | 30.7% | 62.1% | 3.3 | 2.4 | 8.4 | 171 | 27.6% |
| 73 | Itasca | 30.7% | 61.9% | 3.6 | 2.4 | 10.9 | 87 | 30.8% |
| 74 | Wadena | 30.7% | 72.4% | 3.5 | 2.7 | 8.9 | 16 | 29.6% |
| 75 | Roseau | 29.6% | 58.3% | 2.9 | 2.2 | 7.7 | 11 | 29.7% |
| 76 | Koochiching | 28.4% | 55.4% | 2.9 | 2.1 | 7.4 | 15 | 31.0% |
| 77 | Chisago | 28.3% | 61.7% | 3.2 | 2.4 | 9.1 | 188 | 30.4% |
| 78 | Kittson | 27.9% | 53.5% | 4.3 | 1.9 | 20.5 | 4 | 27.1%* |
| 79 | Washington | 27.9% | 61.4% | 3.2 | 2.4 | 8.1 | 1,519 | 31.2% |
| 80 | Mille Lacs | 27.7% | 58.1% | 3.1 | 2.3 | 8.5 | 48 | 28.7% |
| 81 | Ramsey | 26.8% | 64.5% | 3 | 2.4 | 7.1 | 2,551 | 29.4% |
| 82 | St. Louis | 26.6% | 56.4% | 3.3 | 2.2 | 9.2 | 602 | 27.0% |
| 83 | Lake | 25.6% | 48.2% | 2.8 | 1.9 | 8.1 | 33 | 25.4% |
| 84 | Benton | 23.1% | 57.4% | 2.8 | 2.2 | 7.6 | 102 | 29.3% |
| 85 | Lake of the Woods | 20.0% | 50.0%* | 2.2 | 1.6 | 9.6 | 2 | 35.3%* |
| 86 | Isanti | 15.7% | 50.5% | 2.5 | 1.9 | 6.8 | 110 | 16.0% |
| 87 | Anoka | 15.3% | 47.0% | 2.3 | 1.8 | 6 | 1,409 | 16.2% |
Average, median and 95th percentile are in pCi/L. Source: Minnesota Department of Health, Public Health Data Access portal, radon testing by county, 2016 to 2025, read September 15, 2026; prior-period column from the county layer of the MDH interactive radon map, 2010 to 2020.
Use this table. The table, the map and the CSV file on this page are published under a Creative Commons Attribution 4.0 license (the rest of this site stays all rights reserved): copy them, shorten them, put your county's row in a newsletter, a handout or a news story, with a credit to Minnesota Radon Pros and a link to this page. The underlying data is MDH public data and belongs to MDH.
Download the table as a CSV fileHow to read these numbers honestly
Four cautions keep the table useful, all from MDH's own description of the data. The results come from 11 radon test laboratories, so they cover homes whose owners chose to test, not every house in the county, and MDH says the data does not include every radon test run in Minnesota. The "4 pCi/L or more" column counts a property once, by its highest test, and keeps post-mitigation tests in, because MDH treats any elevated result as worth knowing; the average and median exclude post-mitigation tests. Small counties swing: a county testing a few dozen homes a year can move several points between periods on a handful of results. And county figures hide wide house-to-house swings, since MDH says a home can test very differently from the house next door, which is why MDH pushes individual testing over map reading. The EPA's Minnesota zone map is a prediction built from indoor measurements, geology, aerial radioactivity, soils and foundation types to set priorities, not a measurement of any home.
Minnesota radon map: what the MDH and EPA maps show
The map below colors every county by the share of tested properties at or above 4 pCi/L in the MDH table above. Two official maps sit behind it. MDH's interactive radon map shows measured results by county and by census tract, searchable by address. The EPA's Map of Radon Zones is older and coarser: it sorts counties into three zones of predicted radon potential, and most of Minnesota is Zone 1, the highest. Where the two disagree, trust the measurements, and then test your own house.
Radon levels by ZIP code in Minnesota
MDH does not publish radon results by ZIP code. It publishes the county table above and, on its interactive radon map, results by census tract, which are smaller than most ZIP codes and the closest public look at your neighborhood. Search the map by address to see your tract's share of tests at or above 4 pCi/L. Treat it as a reason to test, not a substitute for testing: MDH's data finds high and low readings on the same street.
Winter readings run higher
MDH's data portal charts seasonal variation in average radon levels, and the heating season is the high side: closed windows and a running furnace hold a house under slight negative pressure that draws soil gas in. That is why MDH says the heating season is the best time for a short-term test, and why MDH's testing guidance sends a first result between 2 and 7.9 pCi/L to a long-term follow-up test that spans the heating season. What to do with a high result is on our high radon test result guide.
Why the counties differ: a 90-second geology tour
The southwest and south-central counties top the table, and the U.S. Geological Survey's radon-potential report explains why: western and southern Minnesota sit on Des Moines lobe glacial tills, silty clays derived from Upper Cretaceous sandstones and shales that carry relatively high uranium and give off radon readily. The southeast sits above the statewide share but below the top 10, on karst: soluble carbonate bedrock, sinkhole-pocked, documented in the DNR karst mapping, where USGS notes that solution cavities and fissures add pathways for gas flow toward foundations in places like Rochester and Winona. The northwest, along the Red River Valley, lies on the silt and clay bed of Glacial Lake Agassiz, which the DNR describes as a poorly drained plain. The northeast around Duluth sits on igneous bedrock, including the Duluth Complex, that USGS rates generally low in uranium, which is why the North Shore counties sit low in the table. Nearly everything else lies under the glacial till the Minnesota Geological Survey maps statewide. Different deposits, same uranium decay chain, per MDH.
From data to action
Whatever your county shows, the sequence is identical: test your home, and if the result is at or above 4 pCi/L, the fix is a radon mitigation system installed by an MDH-licensed contractor, which MDH says generally costs $1,500 to $3,000; the Minnesota cost guide explains where a specific house lands in that range. Local context for the biggest markets is on our city pages, including Rochester, Duluth, Minneapolis, St. Paul, and St. Cloud.